
Intent Data Measurement: How to Know If Your Intent Data Is Delivering Results
Follow us

B2B buyers are usually in the middle of a lengthy research phase before picking up the phone to talk to sales. They read articles, check vendors, look at product pages, download resources, and look to the web for their answer. These buyer signals help to develop meaningful intent data signals towards ROI. You have to determine if reacting to these signs will lead to higher engagement, deeper pipeline, faster deals and closed business. That’s where Intent Data Measurement comes into play. It provides support for marketing, sales, and revenue operations teams to understand the value of their buyer research activities in commercial terms. Teams can no longer just operate on account scores, web visits, or topic shots; they can link intent activity to outcomes in the CRM.
Anteriad research revealed that 97% of marketers surveyed said that intent-data-driven leads produced more pipeline and 86% said that converting intent-data leads into MQL-to-SAL was stronger. Your performance metrics should still be the real determinant of success, though. Effective intent data measurement addresses one big question: Is B2B intent data as effective as your typical process for go-to-market results?
What Should Intent Data Measurement Actually Prove?
The Real Question: Does Intent Create Better Revenue Outcomes?
Yes. Intent definitively leads to better revenue outcomes. This is because the company focuses exclusively on engaged prospects. Cold outreach is completely eliminated and interactions can begin at earlier touchpoints. Companies that have adopted buyer intent signals have experienced increased conversion rates, lower sales cycle lengths, and better use of resources.
Separate Signal Quality From Business Impact
To differentiate signal-quality from business impact, you need to measure data accuracy separately from financial output. Signal-quality measures the technical accuracy, completeness, and consistency. Business impact considers how the movement of the data corresponds to revenue, retention, and growth.
Measure Intent-Triggered Accounts Against Your Normal Baseline
In order to measure the intent-triggered account against a normal baseline, you need to compare current spike volume to historical norms. This measurement is executed for volume in that category and calculate trend and surge scores. Success then means demonstrating the relative gap in performance metrics between intent-driven initiatives compared to untargeted outbound efforts.
Start With the Intent Data Metrics That Connect to Pipeline
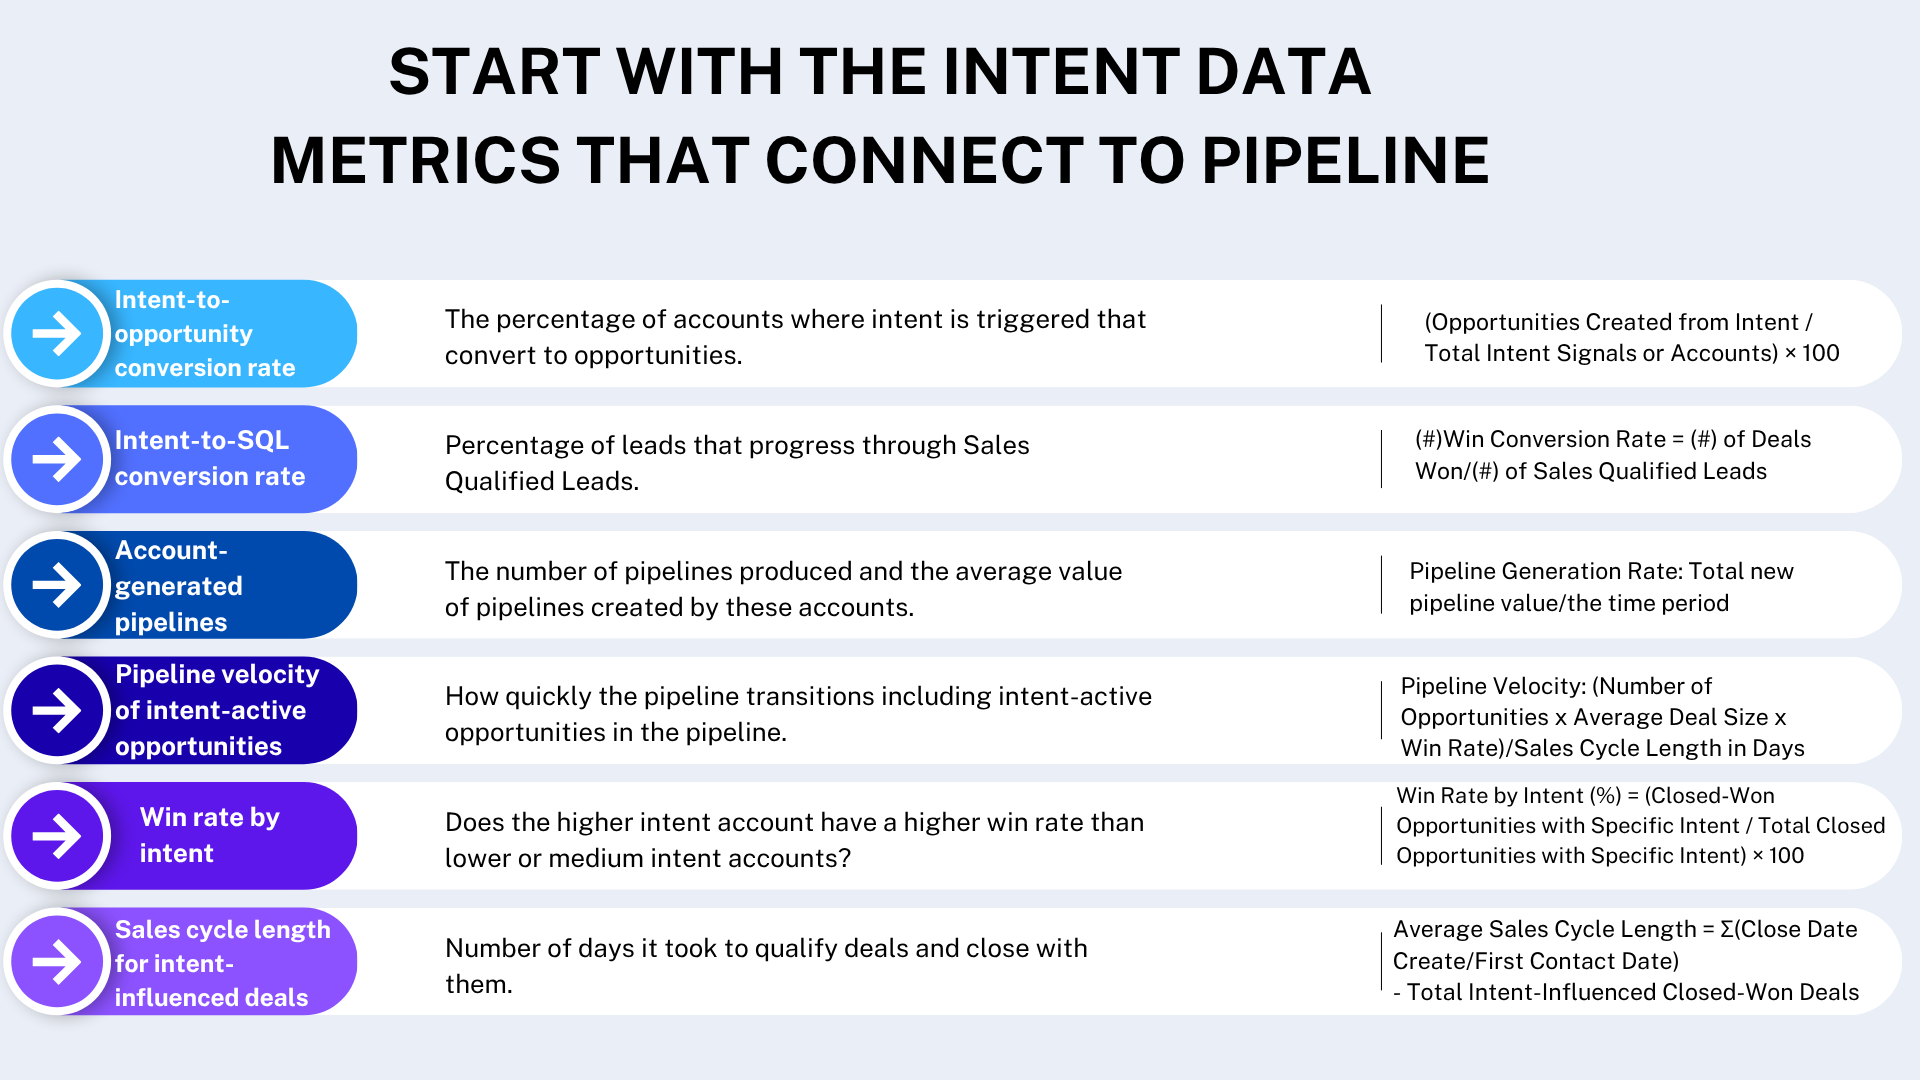
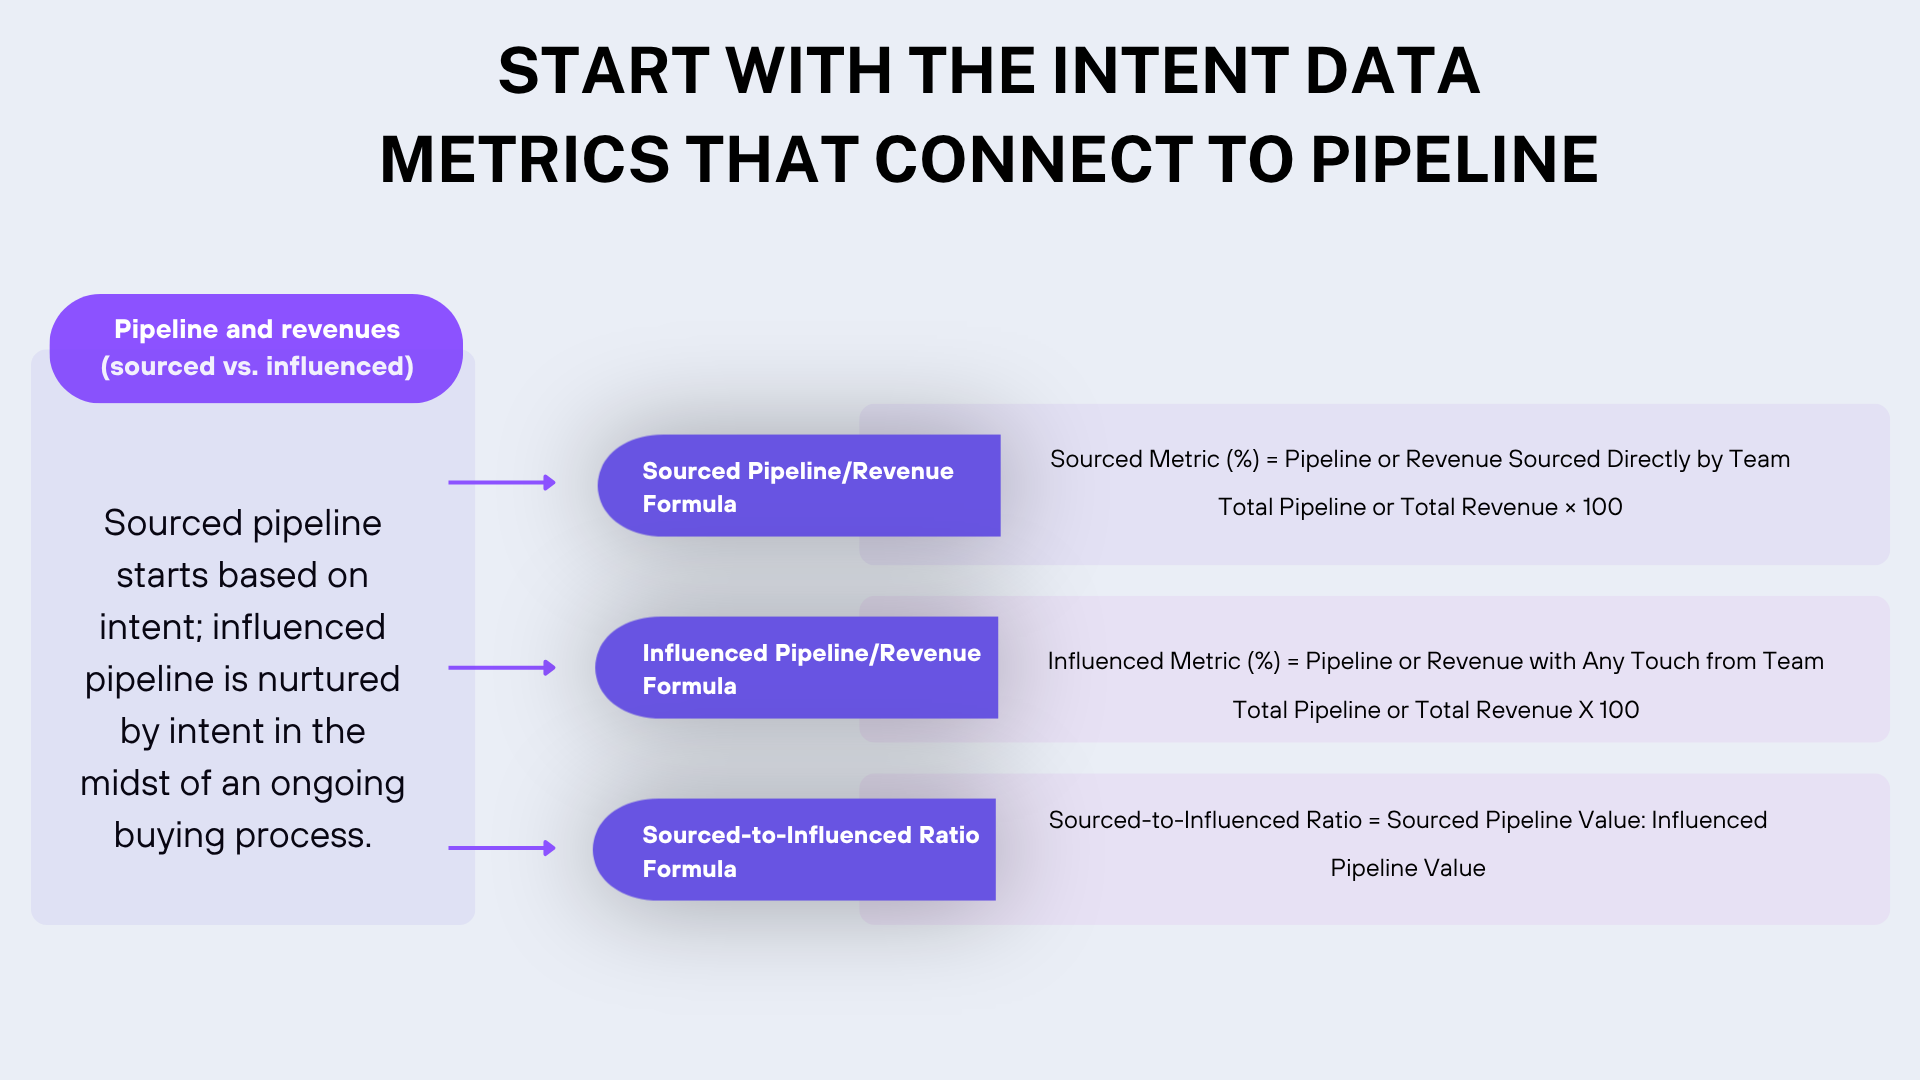
A Practical Intent Data Measurement Framework
Step 1 — Define What Success Means for Your GTM Team
Define the outcome, then choose the metrics. Do you want more qualified meetings, more opportunities converting, less sales cycle or more revenue from specific accounts?
Step 2 — Select the Intent Signals You Actually Trust
Rank signals by relevance to your ICP, product type, sales plays with intent scoring. If possible, blend first-party engagement with credible third-party research activity.
Step 3 — Establish a Non-Intent Baseline
Record your actual conversion rate, sales cycle length, win rate and value of your pipeline before turning on intent workflows to create a benchmark.
Step 4 — Connect Intent Activity to CRM Records
Plan out accounts, contacts, opportunities, revenue and campaigns. Store signal date, topic, intensity, source and action taken.
Step 5 — Track Intent-Triggered Marketing and Sales Actions
Monitor your post-signal results. Measure exposure to advertising, email campaigns, sales calls, meetings, content suggestions or speed of response.
Step 6 — Compare Conversion, Velocity, Win Rate, and Revenue
Analyze intent and non-intent accounts in same time frame and using same account criteria. A separate control group can illustrate the impact of intent versus other influences.
Step 7 — Optimize the Signals and Plays Producing the Best Pipeline
Remove signals that generate activity but no action, pipeline and progress. Increase investment on topics, account segments and plays that consistently generate qualified pipelines.
Measure Intent Data Against a Baseline Not in Isolation
The important point is to have a control group. Otherwise, you might get pipeline throughput accounts that would have converted. You might wrongly believe that it’s because of intent data. Similar recommendations are made in current guidance on marketing ROI: baseline comparisons and control groups where possible to help isolate intent’s contribution.
For instance, segment the ICP accounts into two groups that are similar. Provide one of the groups outreach on intention and the other your regular outreach. Track and compare the statistics of replies collected, meeting collected, pipeline per account, opportunity conversion, and closed-won revenue for an appropriate time period.
Is Your Intent Data Actually Improving Lead and Account Quality?
Intent data analytics should provide teams with actionable insight to provide opportunities – not increased activity. Analyze whether intent-active accounts have a better firmographic fit, bigger potential contract value, and more relevant stakeholders and quality engagement.
Researchers have seen benefits from intent data with increases in conversion, pipeline generation, lead-to-customer conversion, and lead velocity in campaigns. These are all great reference numbers to work from, but numbers should be broken down by industry, account tier, product and motion.
Track Intent Data Performance Across the Entire Buyer Journey
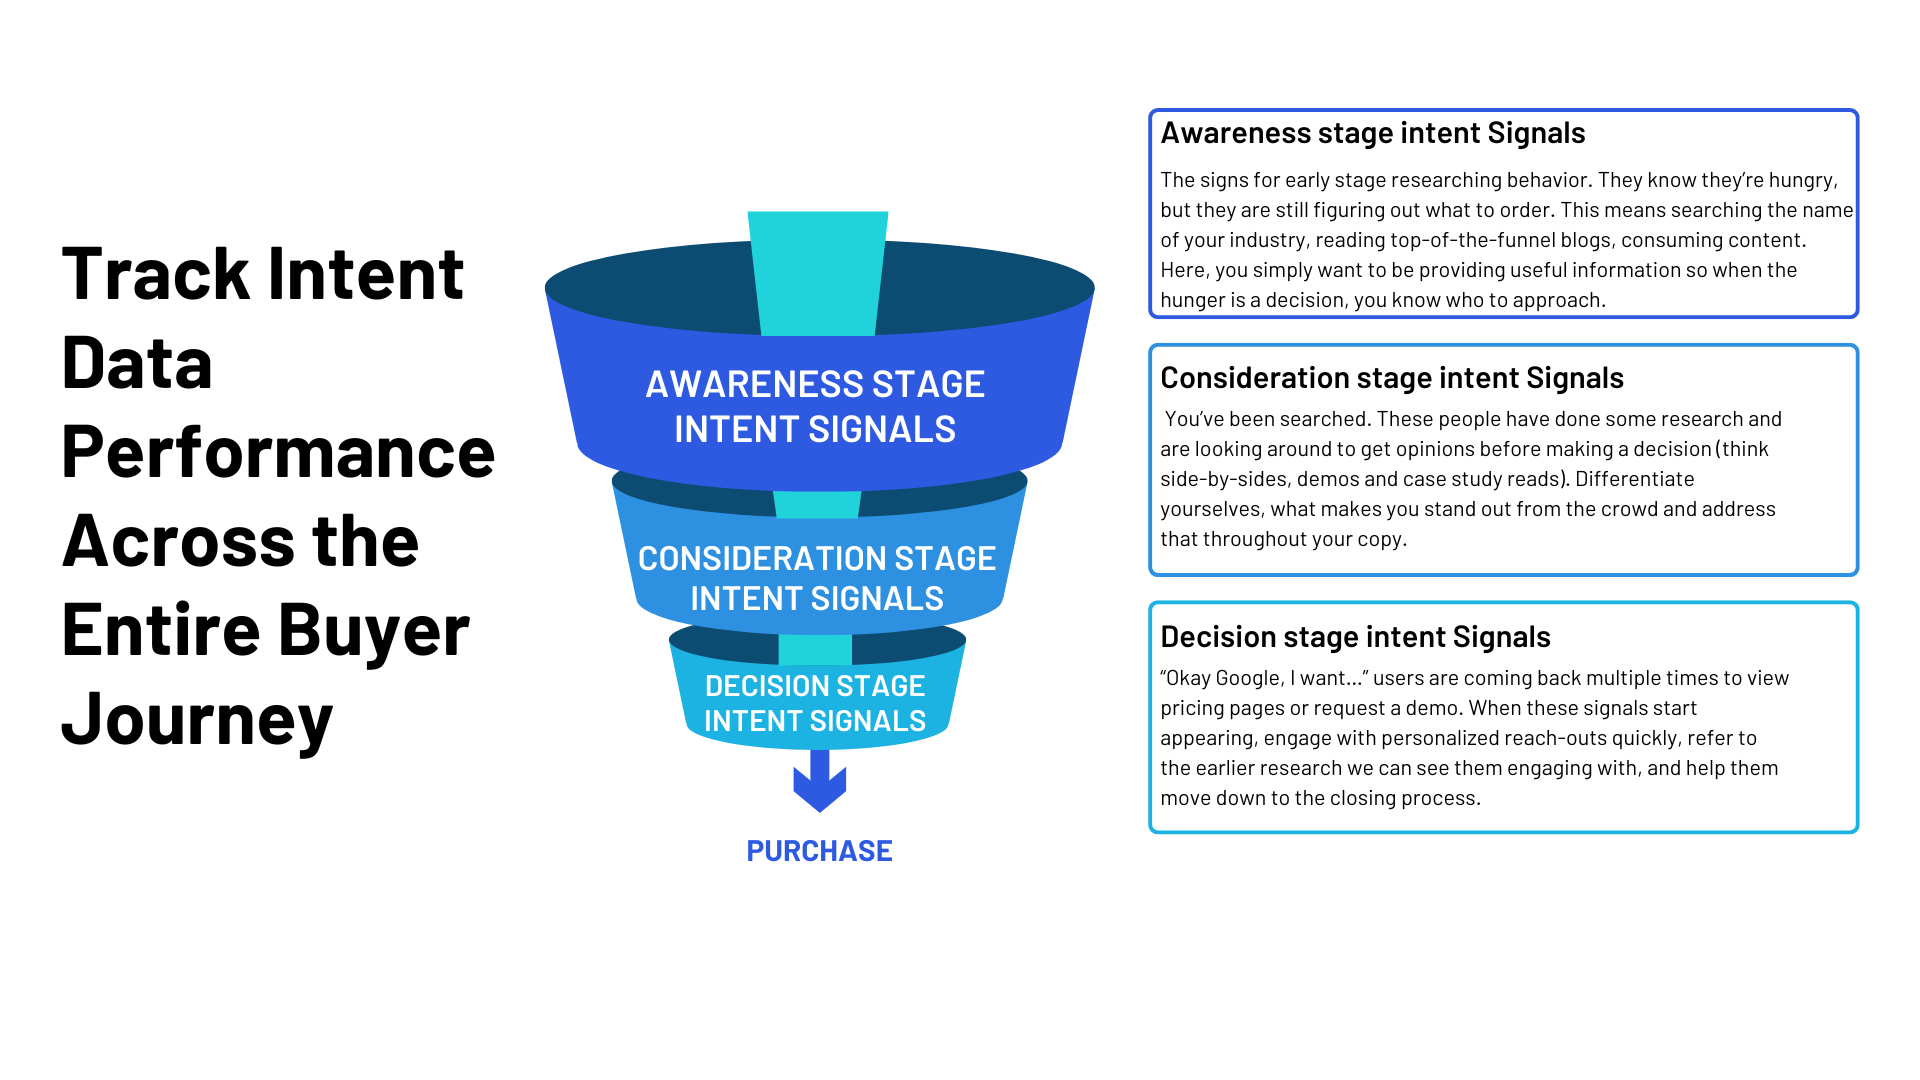
Which Intent Signals Are Actually Worth Measuring?
Buying signs are easiest to spot with your existing accounts exploring the subject.
- Website activity & behavior: Visits to competitors, visits to solutions provider websites, deep dives into pages like pricing and ROI guides, revisits.
- Content Engagement: Downloading whitepapers, case studies, or ROI guides, attending webinars, reading blog posts, visiting resource pages, viewing product reviews, comparison pages, etc.
- Search intent: Searches using your brand name or category generic term, searches showing problem, competitor comparison, or solution intent.
High-Intent Page Visits and Conversion Actions
High-Intent Page Visits
The visit where a visitor shows an interest in purchasing – called a high-intent visit. The visitor engages with several of the most costly pages such as:
- Price
- Product page
- Cart
- Checkout
Conversion Actions
Clicks of high intent visits guide customers towards purchase by offering content such as quick form completion or Demo booking, adding a product to the cart.
Measure the ROI of Your Intent Data Investment
You can’t understand your return until you understand your investment. Being thorough with what you’re spending allows you to see exactly which costs you should cut to improve the return. Make sure to include:
- Third-party intent platform spend (like Demandbase)
- Ad spend (LinkedIn, programmatic, content syndication)
- Internal work (marketing ops, SDR time)
- Martech spend (CRM, pipeline attribution, enrichment tools)
- Creative & content production
Then, just add up any costs tied directly to your campaign.
Formula: Total Investment = Platform Costs + Ad Spend + Resource Cost + Tooling Cost
Example: $12,000 (platform fee) + $18,000 (ads) + $10,000 (SDR + marketing time) + $5,000 (tools)
Total Investment = $45,000
How to Build an Intent Data Measurement Dashboard
“You measure it, you manage it. You see it, you deal with it”. In order to make your intent data actionable, your team need to be able to see it and interpret it. The use of the appropriate dashboards gives teams like sales, marketing and operations an account of what they need to be seeing, based on their objectives and role.
Sales dashboard should reveal:
* My high-intent accounts (Tier 1).
* What’s driving intent score.
* Time since last intent signal.
* Top research topic in the account.
* Any previous sales follow-up and when.
Marketing dashboard should show:
* Total accounts by tier.
* Rate at which accounts are moving up or down each tier in a given week.
* Individual campaign performance by tier.
* Intent to opportunity conversion rates.
* Which research topic has led to a best-performing nurture sequence.
Operations dashboard should reveal:
* Data sync status.
* Data pipeline lag.
* Any integration errors.
* Automation workflow statistics.
However, clear dashboard displays will not bring revenue unless the intent signals themselves were correct in the first place.
Common Intent Data Measurement Mistakes
Mistake 1: Measuring Activities Not Outcomes
Identifying accounts is an activity, not an outcome. Eg “A company identified 500 high-intent account”.
Solution: In the following example, “Of 500 high-intent accounts, 78 converted (15.6%)”. So 78 conversions (15.6%) are the outcomes.
Mistake 2: Sales Cycle Lag
High intent accounts may be identified in Month 1, but the account closed the business 5 months down the line in Month 5. If you only compare the first three months it will underrepresent the true impact.
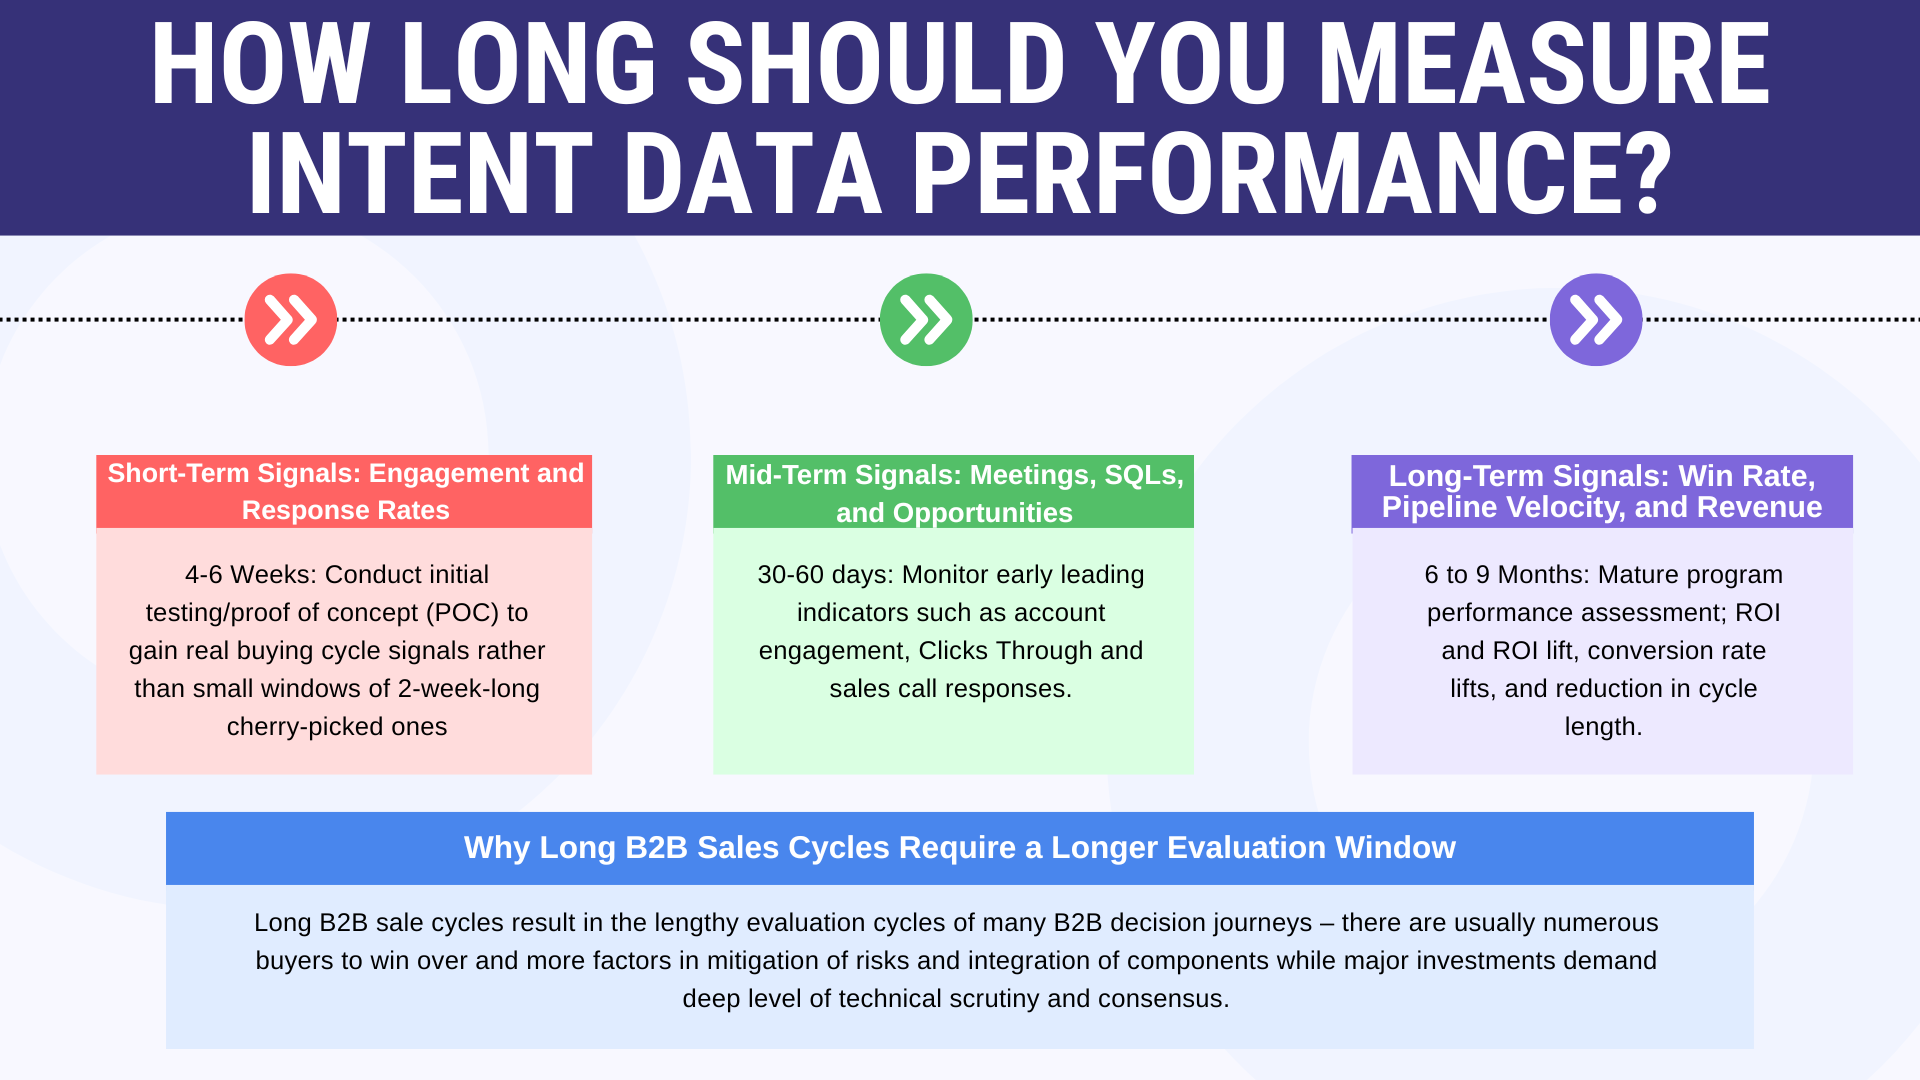
Solution: Take a lead from the data when lead scoring: Give it at least 6 to 9 months before judging its success.
Mistake 3: Wrong Comparison With Other Sales Lead Sources
Compare intent led data to all lead data. The problem with this approach is that you’re comparing them against a dataset that is saturated with some junk.
Solution: Better: Compare to your best performing, current sales lead source
Mistake 4: Failure to segment
When viewing results, companies forget to segment their activities. Thereby bringing inaccurate results.
Solution: Filter by: Industry; Company size; Deal size; Sales rep; Buyer personas. The overall numbers mask where intent data is driving sales and where it isn’t.
How Long Should You Measure Intent Data Performance?
Conclusion: Intent Data Is Only Valuable When It Changes Outcomes
Here is another excuse to not use intent data, since the groups were buying it. When your team leverages those signals to make sounder business decisions and generate greater business results, it’s of great value. This is why Intent Data Measurement needs to tie into each step of the buyer journey from account research through to closed revenue. This is the process you will follow to measure, from the bottom up:
Signal Quality → Account Quality → Engagement → Conversion → Pipeline Velocity → Win Rate → Revenue → ROI
It’s important to start with what success looks like, set a firing baseline, and link the intent activity to any relevant CRM information. Monitor what happens after each intent. After that, compare intent-active accounts to similar accounts that are not intent-active, within a realistic evaluation window.
Intent Data Measurement‘s primary goal isn’t to establish that buyers were interested. Why do you want to do that? To demonstrate that acting on that interest resulted in better outcomes than your normal go-to-market motion. The better the intent, the better the targeting, conversion tracking, speed, and revenue. Thereby, it becomes a growth system than simply another metric on a marketing dashboard.

Author: IDBS Global
Turning Data into Demand, Fueling B2B Growth with Precision and Purpose.